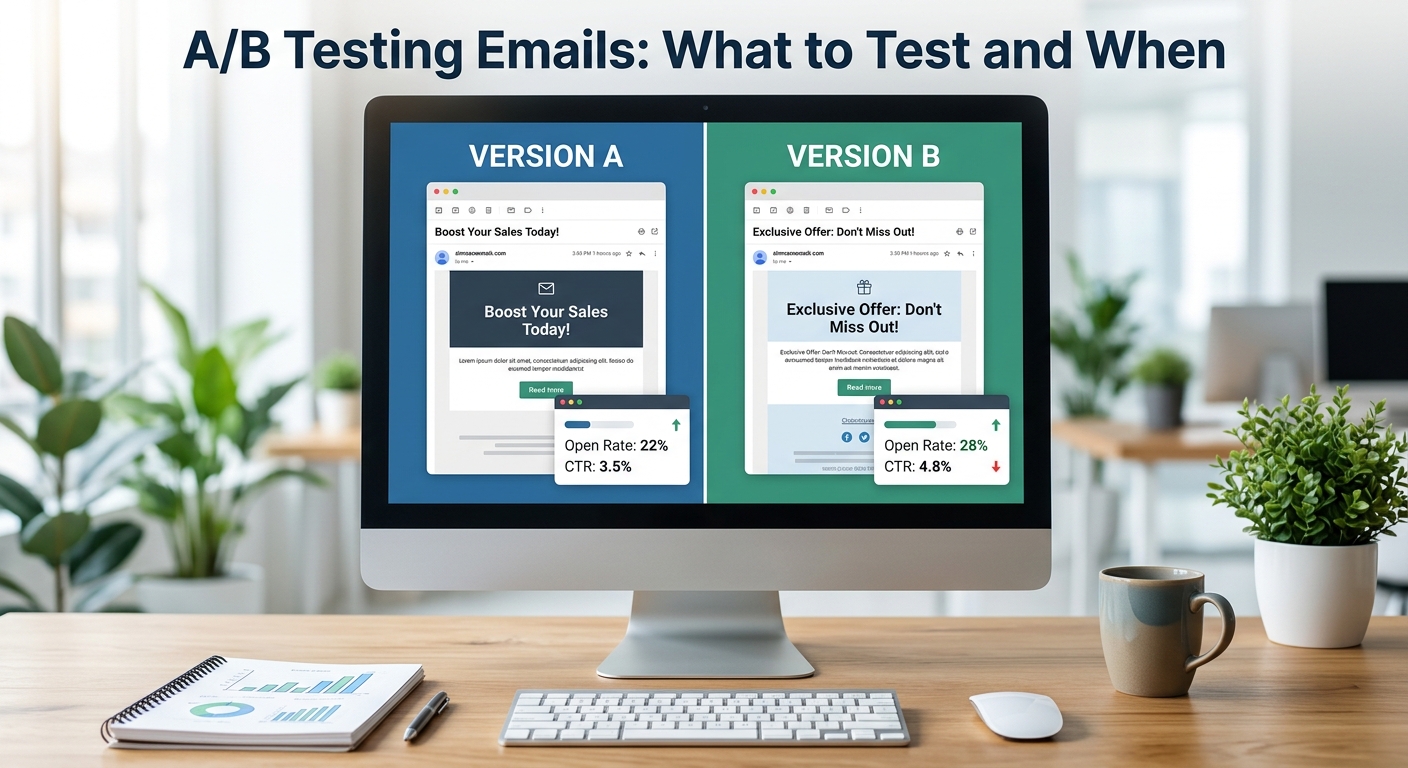
Most email A/B testing produces confident conclusions from data that can't support them.
The mechanics are easy — every platform has a split-test button. What's hard is knowing whether the difference you're looking at is a real effect or noise, and most marketers declare winners on samples far too small to tell the difference. The result is a testing program that generates activity and learnings that don't replicate.
This guide covers what to test, how to size the test properly, and how to read the output honestly. NevTan Engage is the platform referenced throughout: it handles audience splitting, winner selection, and cross-channel measurement from a unified customer profile.
Test one variable at a time. Two changes means you learn nothing about either.
Sample size depends on your baseline rate and the effect you want to detect — not on a fixed number. Detecting a 10% lift in open rate needs roughly 6,000+ recipients per variant, not 1,000.
Write the hypothesis before you send. It's the only defense against reading whatever you want into the results.
Don't peek. Checking repeatedly and stopping when you like the number inflates your false-positive rate dramatically.
Open rate is compromised by privacy features. Judge winners on clicks and conversions.
Most tests will be inconclusive. That's normal, and treating "no clear winner" as a valid result is what separates a real program from theater.
What You Need Before Starting
A platform with native split testing. NevTan Engage splits your audience randomly, runs the variants, and sends the winner to the remainder automatically.
A realistic view of your list size. This is the constraint most people ignore. If your list is 2,000 contacts, you can detect large differences and nothing else — which is fine, as long as you design tests around large differences.
Tracking that survives the click. Set UTM parameters per variant so you can measure conversions, not just clicks. A variant that wins on clicks and loses on revenue is a losing variant.
A written hypothesis. Format: "Changing X to Y will increase [metric] by at least Z% because [reason]." Writing it down before you send prevents post-hoc rationalization, which is the single most common way A/B programs go wrong.
A baseline. Pull your current open, click, and conversion rates from your analytics dashboard first. You can't measure improvement against an unknown starting point.
Step 1: Define Your Metric and Hypothesis
Different problems live in different parts of the funnel. Diagnose before you test.
Symptom | Likely problem | Test this |
|---|---|---|
Low open rate | Inbox-visible elements or deliverability | Subject line, preheader, sender name |
Healthy opens, low click-to-open | Body content or CTA | CTA copy, placement, offer, email length |
Good clicks, low conversions | Landing page, not email | Test the page, not the email |
Falling engagement over time | Frequency or relevance | Segmentation and cadence |
That third row matters more than it looks. If your click rate is strong and conversions are weak, email A/B testing is the wrong tool entirely — you'll optimize the email indefinitely without touching the actual bottleneck.
And before you test anything: if opens are low across every campaign, check deliverability first. A subject line test can't fix a spam-folder problem. Our deliverability guide covers authentication and sender reputation.
Step 2: Choose One Variable
Change exactly one thing. This is non-negotiable — if you change the subject line and the CTA together and the variant wins, you don't know which change won, or whether one helped while the other hurt.
In rough order of leverage:
Subject line — highest impact on opens, and the easiest to change dramatically
Offer — often the biggest swing in conversions
Sender name — personal name vs. brand name
CTA copy — verb phrases beat generic labels
Preheader text — underused, and visible in most clients
Send time
Email length
Hero image
CTA button color — commonly tested, rarely decisive
Start with subject lines. Our subject line formula library gives you structurally different variants to test rather than minor rewording — and structural difference is what makes a test detectable on a normal-sized list.
Log every test. Hypothesis, variable, sample size, result, and whether it was significant. Include the inconclusive ones — knowing that CTA colour has never moved your numbers is worth as much as knowing that urgency does. Feed winners back into your email templates so each result compounds.
Step 3: Split Your Audience Correctly
The standard holdout structure:
Variant A: 10% of list
Variant B: 10% of list
Holdout: remaining 80%, receives the winner after the test window
Requirements for validity:
Random assignment. Not "first 2,000 contacts" — early subscribers behave differently from recent ones.
Mutually exclusive groups. No contact receives both variants.
Identical everything else. Same segment, same send time, same offer, same day.
Adjust the split to your list size. Under 10,000 contacts, a 10/10 split leaves too little data to conclude anything — use 25/25/50, or skip the holdout entirely and split 50/50, applying the learning to your next campaign instead of this one.
Step 4: Size the Test Properly
This is where most email A/B testing breaks down. There is no universal minimum sample size. The number you need depends on two things: your baseline rate, and how large a difference you want to detect.
The rarer the event, the more data you need. Open rates hover around 20%, so differences show up relatively fast. Click rates are closer to 2–3%, so detecting the same relative change takes roughly ten times the audience.
Approximate recipients needed per variant
Testing open rate (20% baseline):
Relative lift to detect | Per variant | Total list needed |
|---|---|---|
10% (20% → 22%) | ~6,400 | ~12,800 |
20% (20% → 24%) | ~1,600 | ~3,200 |
30% (20% → 26%) | ~700 | ~1,400 |
50% (20% → 30%) | ~250 | ~500 |
Testing click rate (2.5% baseline):
Relative lift to detect | Per variant | Total list needed |
|---|---|---|
10% (2.5% → 2.75%) | ~62,000 | ~124,000 |
20% (2.5% → 3.0%) | ~15,600 | ~31,200 |
30% (2.5% → 3.25%) | ~7,000 | ~14,000 |
50% (2.5% → 3.75%) | ~2,500 | ~5,000 |
Figures assume 80% statistical power and a 5% significance threshold. Use a sample size calculator for your specific numbers.
Read those tables carefully, because they invert the common advice. "At least 1,000 per variant" is only adequate for detecting large effects. If you want to catch a modest 10% improvement in click rate, you need tens of thousands of recipients per variant — which most lists simply don't have.
What to do if your list is small
Not "test anyway and hope." Instead:
Test dramatic changes, not subtle ones. A completely different subject line angle, not a reworded version of the same one.
Test the same hypothesis across several sends and aggregate the results rather than judging one campaign.
Accept directional findings. Label them as such in your log so you don't build strategy on a coin flip.
Test at the strategy level instead — cadence, segmentation, offer type — where effects are larger and easier to see.
Duration
Run the full window regardless of what the early numbers say. Two to four hours is typical for open-rate tests on large lists; 24 hours is safer for click and conversion tests, since click behavior trails opens by hours or days.
Don't peek and stop. Repeatedly checking and halting the moment a variant pulls ahead inflates your false-positive rate far above the 5% you think you're accepting. Early leads reverse constantly — that's what random variation looks like.
Step 5: Analyze and Apply
Three possible outcomes, and all three are legitimate:
Clear winner (statistically significant). Implement it, log the underlying principle — not just the winning text — and design your next test to check whether that principle generalizes.
No clear winner. Genuinely common and genuinely fine. Either the change was too subtle to detect, or there's no real difference. Don't force a winner from a 1.2-point gap on 800 recipients.
Winner on the wrong metric. A variant with more opens and fewer conversions has not won. Curiosity-gap subject lines do this constantly: they pull people in and then disappoint them, and the cost shows up in unsubscribes rather than in the test result.
⚠️ A note on open rates. Apple's Mail Privacy Protection pre-loads tracking pixels whether or not a human opened the message, and corporate security scanners generate phantom opens and clicks. Open rate is now directional at best. Where the decision matters, judge on clicks and conversions.
Track results downstream in NevTan Engage's reporting, which follows the customer journey past the click rather than stopping at the click.
Worked Example (Hypothetical)
The following is an illustrative scenario built to show the workflow and the arithmetic. It is not a customer case study.
Setup: An online fitness store with 20,000 engaged contacts. Baseline open rate 18%, click rate 1.5%.
Hypothesis: A benefit-focused subject line will outperform an announcement-style line by at least 20%, because it tells the reader what they get rather than what we did.
Variant A | Variant B | |
|---|---|---|
Subject line | New Workout Gear Just Landed | Your Next PR Starts Here |
Angle | Announcement | Benefit + curiosity |
Sent to | 2,000 | 2,000 |
Open rate | 17.5% | 24.2% |
Sizing check first. At an 18% baseline, detecting a 20% relative lift needs roughly 1,700 per variant. At 2,000 each, the test is adequately powered — so this is a test worth running, and that check happens before the send, not after.
Result. A 6.7-point absolute gap on 2,000 per group is well beyond the margin of error. NevTan Engage sends Variant B to the remaining 16,000.
What gets logged. Not "Your Next PR Starts Here works." The transferable finding is: benefit-focused framing outperformed announcement framing by ~38% relative in one test. One result is a signal, not a rule — the next test should check whether the pattern holds on a different campaign before it becomes house style.
What's still unknown. Whether the extra opens converted. Until the click and revenue data comes in, Variant B has won the open-rate test and nothing more.
How to Choose What to Test First
Follow the leak. Test the earliest stage in your funnel that's underperforming, because gains there flow through everything downstream.
Opens below ~20%? Subject line and sender name first. But rule out deliverability before assuming it's a copy problem.
Click-to-open below ~10%? The body is the issue. Test CTA copy and placement, then the offer.
Clicks fine, conversions weak? Not an email problem. Test the landing page.
Transactional emails? Test clarity and prominence of the primary action — not persuasion.
Promotional emails? Test the offer itself. Presentation changes rarely beat a genuinely better offer.
Testing also can't fix a targeting problem. If you're sending the same campaign to your whole list, better segmentation will beat any subject line you can write — see customer segmentation fundamentals for where to start.
Why A/B Testing Works
A/B testing works because it isolates a single change and lets randomization handle everything else. Two randomly assigned groups differ in exactly one respect, so any reliable difference in outcome is attributable to that change.
The word doing the work is reliable. Randomization gives you causal attribution; sample size gives you the ability to tell signal from noise. Skip the second and you've built a machine for generating confident, wrong conclusions.
Subject lines earn top priority for a structural reason: it's the only element that determines whether anything else in your email gets seen. A CTA improvement can only act on people who opened. A subject line improvement expands the population everything downstream applies to.
The second reason to test rather than copy best practices: results are audience-specific. Emoji lift opens for some lists and depress them for others. Personalization tokens help in some contexts and read as intrusive in others. Published benchmarks describe someone else's audience. Your test describes yours — which is the entire point.
Common Mistakes
Mistake | Why it breaks the test | Fix |
|---|---|---|
Testing multiple variables | No attribution possible | One variable per test |
Underpowered sample | Detects noise as signal | Size against baseline rate and target effect |
Peeking and stopping early | Inflates false positives well past 5% | Pre-commit to the window |
Forcing a winner | Builds strategy on randomness | "Inconclusive" is a valid result |
Judging on opens alone | Inflated by privacy tools; weak revenue link | Confirm with clicks and conversions |
Testing trivial differences | Effect too small to detect | Test structurally different variants |
Not logging results | Same tests repeated forever | Central log, including failures |
Testing during anomalies | Holidays and outages distort results | Avoid unusual periods |
More broadly, testing amplifies whatever your program already is. If the fundamentals are shaky, fix those first — our roundup of common email marketing mistakes covers the ones worth addressing before you optimize.
FAQ
How long should I run an email A/B test?
Long enough to collect the sample your test needs, then stop at the pre-committed time. Open-rate tests on large lists often conclude in 2–4 hours; click and conversion tests usually need 24 hours or more, since clicks arrive over a longer window. Never stop early because a variant is ahead.
How large does my sample need to be?
It depends on your baseline rate and the effect size you want to detect. Detecting a 10% relative lift in a 20% open rate takes roughly 6,400 recipients per variant. The same relative lift in a 2.5% click rate takes around 62,000. Larger effects need far less — a 50% lift in open rate is detectable with a few hundred per variant.
Can I A/B test on a small email list?
Yes, with adjusted expectations. Under about 2,000 contacts you can only reliably detect large differences, so test dramatic changes and treat results as directional. Running the same hypothesis across several sends and aggregating is more reliable than judging one campaign.
What's the difference between A/B testing and multivariate testing?
A/B testing compares two versions differing in one variable. Multivariate testing compares multiple variables simultaneously to measure how they interact — which requires dramatically larger samples. For email, A/B testing is almost always the right choice.
Should I test the sender name?
Yes. Many recipients decide whether to open based on who sent it before reading the subject line. Testing a personal name against a brand name is a high-leverage, low-effort test, and results vary meaningfully by audience.
How do I know if results are statistically significant?
Most platforms calculate this for you, typically reporting a p-value. Below 0.05 conventionally means the result is unlikely to be chance alone. Significance is necessary but not sufficient — a significant result on a metric that doesn't drive revenue still isn't a business win.
What if my test shows no clear winner?
Log it and move on. Either the change was too subtle or there's no real difference. Both are useful. Next time, test a more structurally different variant rather than adding more data to a small effect.
Can I A/B test across channels?
Yes, though the mechanics differ. SMS and push have shorter copy and different response windows — see our SMS and channel comparison guides. Cross-channel testing needs a unified profile so you can attribute conversions correctly.
Start With One Test
You don't need a testing program. You need one test, run properly.
Pick your next campaign. Write a hypothesis. Change one thing — the subject line, structurally, not cosmetically. Check that your list can actually detect the effect you're looking for. Send it, wait for the full window, and log what happened, including if the answer was "nothing measurable."
Do that eight times and you'll have something most marketing teams never build: documented knowledge about your specific audience, rather than borrowed benchmarks about someone else's.
NevTan Engage handles the splitting, winner selection, and significance calculation, and unifies email, SMS, push, and WhatsApp on one customer profile so you can measure conversions across the whole journey rather than one channel at a time. See plans and pricing or start with your first campaign.